NYC Stop-and-Frisk Visualization

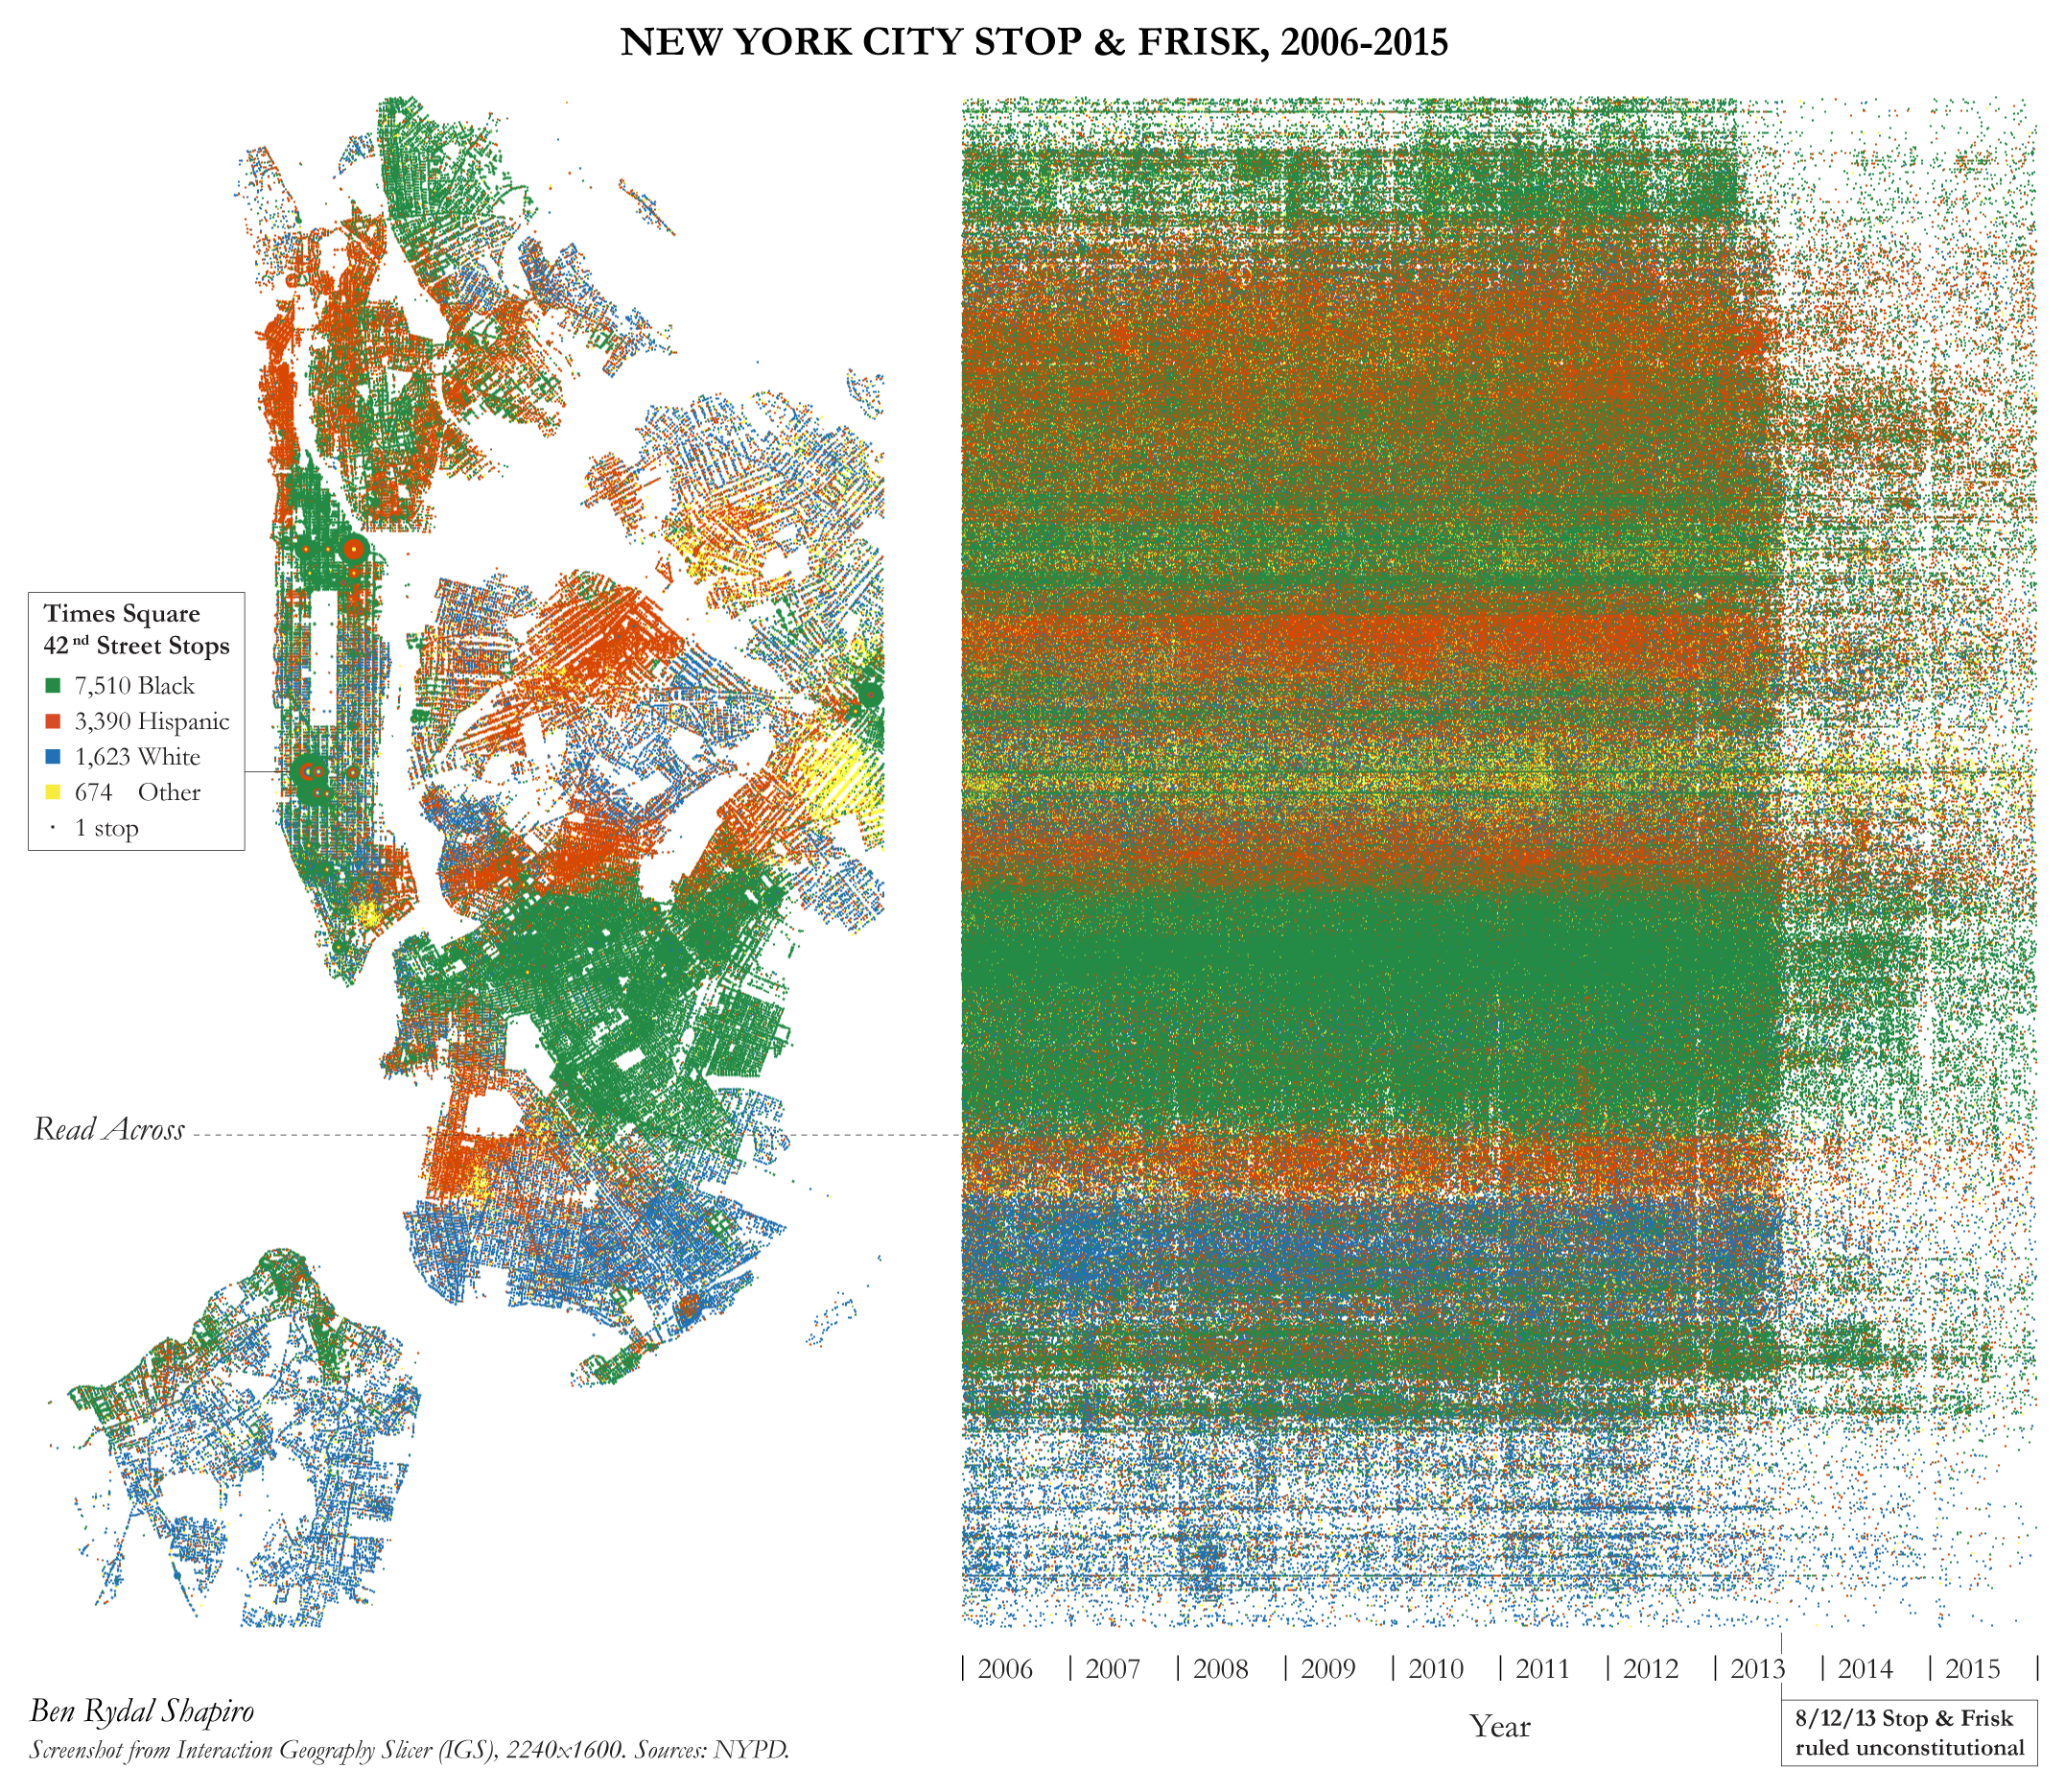
This project uses the Interaction Geography Slicer to visualize all recorded street stops collected by the NYPD from 2006-2015, revealing spatial and temporal patterns across race, geography, and time—including how stop-and-frisk activity changed dramatically following the August 12, 2013 court ruling against the program.

Stop and Frisk Spatial-Temporal Distribution
Figure 1: All recorded stops collected by the NYPD from 2006-2015. Dot size corresponds to the number of stops in a location and color indicates race. The dual-view shows geographic distribution (left) and temporal change (right), revealing an abrupt decline following the August 12, 2013 court ruling.
Felonies Comparison Visualization
Figure 2: New York City felonies recorded by the NYPD at the same scales and dot conventions as stops in Figure 1. Felonies remained relatively stable from 2006-2015, contrasting sharply with dramatic fluctuations in stop activity, supporting research suggesting stop-and-frisk practices may not directly influence crime rates.
Broadway Street Analysis
Figure 3: Stops and murders along Broadway Street, one of the oldest North-South thoroughfares in Manhattan. This visualization facilitates discussion about how policing responds differently to violent crime across neighborhoods.

Ben Rydal Shapiro

Assistant Professor, Georgia State University

© 2026 Ben Rydal Shapiro. All rights reserved.